Events Funnel
The Events Funnel report allows you to quickly build chains of events (sequences) from your playable experience and visualise the resulting data.
By creating multiple chains in one report, you can identify the changes in your performance based on different user interactions and journeys through the playable.
Generate a report
Similar to the Events Overview page, the Events Funnel allows you to generate custom reports using the report builder.
The key difference here, is that you are able to build up chains events, and view data only related to playable ad sessions which contain the specific sequence of events.
Each chain can contain up to five events, and you may view up to five chains in one report.
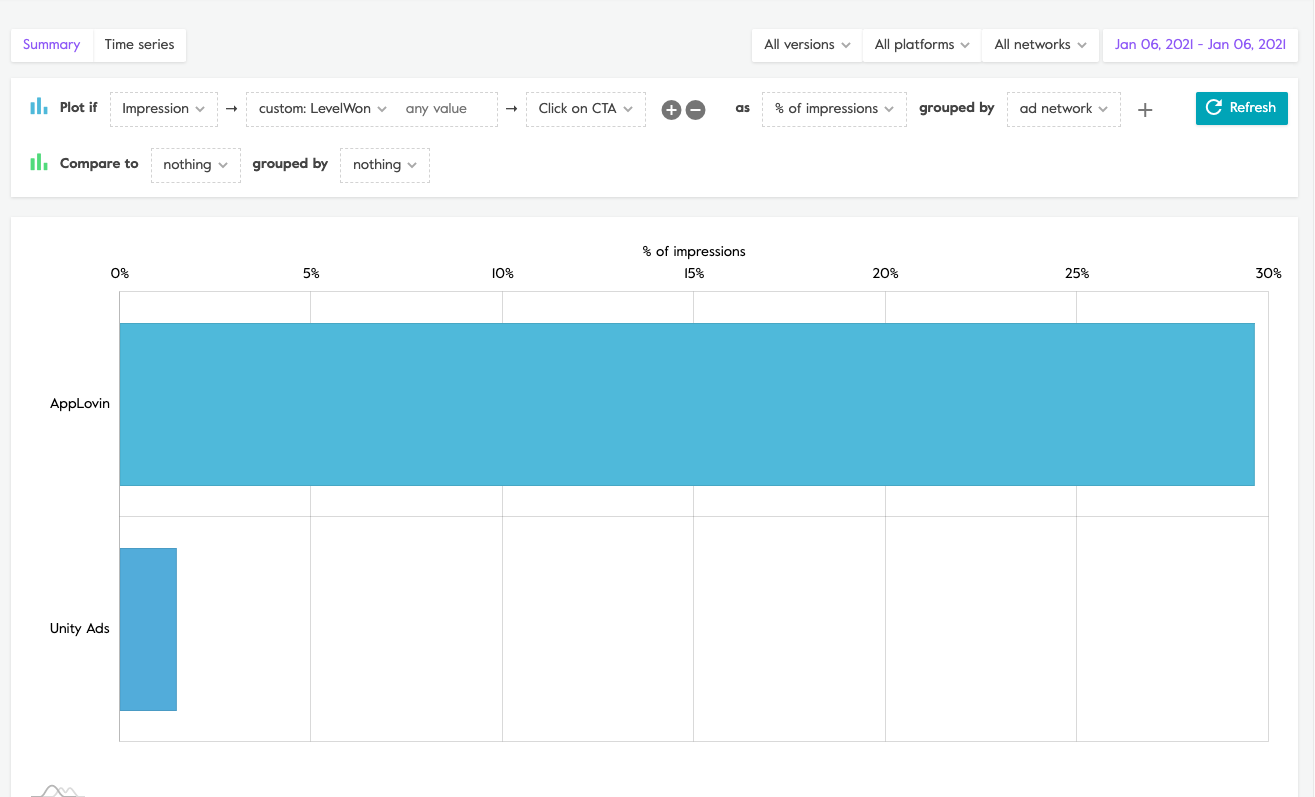
Example chain

Here we can see the % of impressions with the following sequence:
Impressions > Level Won (1) event > Click on a CTA
Any report that you generate in the Events Funnel page is created using our report builder and will follow the same structure. The top level filters will be applied to any report that you generate.
Event chains - select which events you are interested in analysing from the drop down menu. You may add up to five events per chain.
View - how you would like to see this event, using one of the following:
- number of events
- number of sessions
- % of sessions
- % of impressions
- % of a Custom Event
- Grouping - the dimension by which you would like to slice the data:
- nothing
- ad network
- os name
- country
- version
- locale
- event parameter
- Compare to - you can also implement a single event view as a comparison, when creating your report i.e. compared to total number of impressions.
Examples: What kind of data can I see?
By using the report builder, you can fully explore your data to be able to answer questions about certain event chains in your playables.
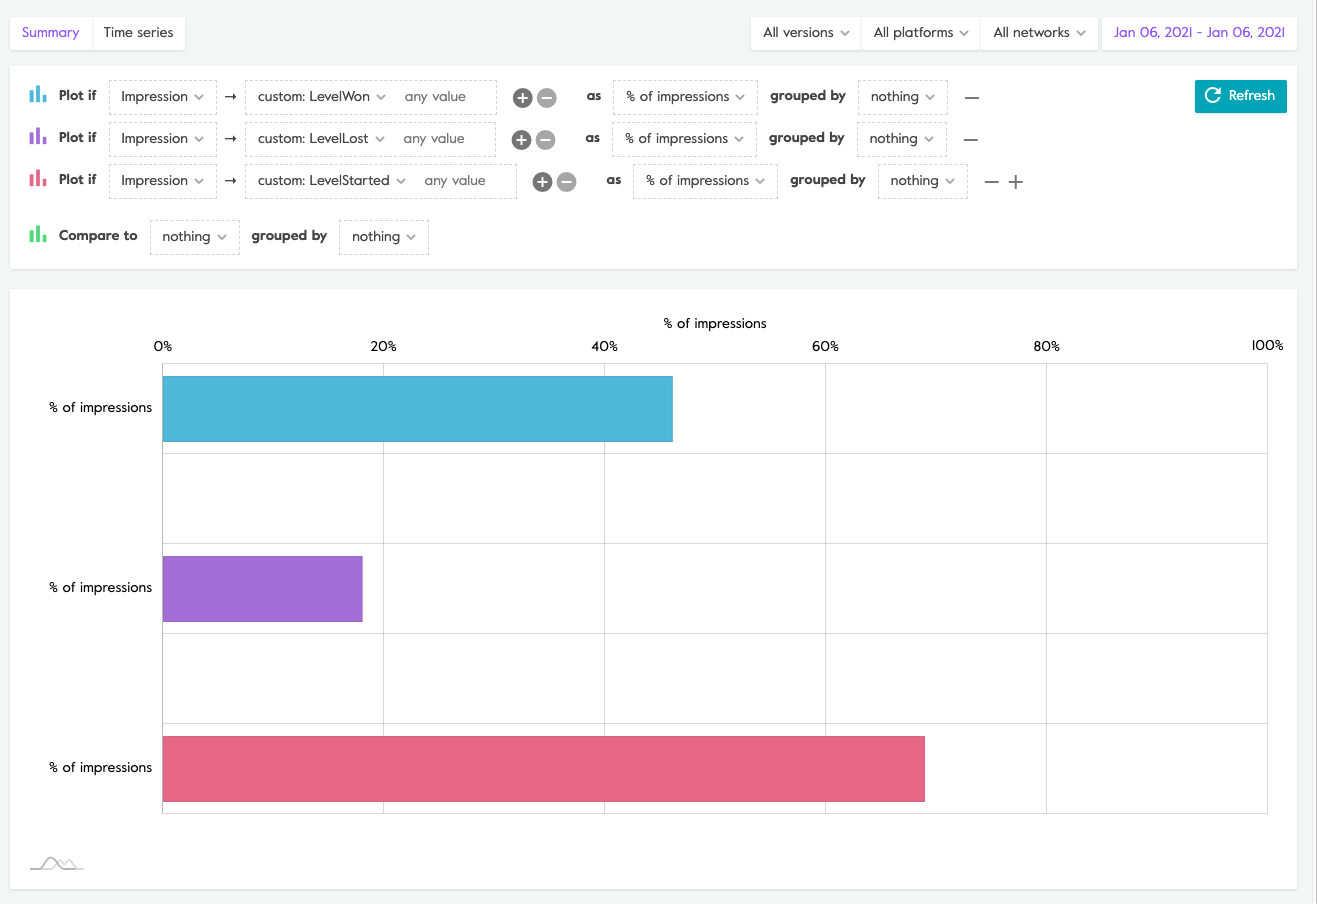
What % of impressions have a Level Won vs Level Lost event, compared to Level Started?
Event Chain #1:Impressions > Custom Event: Level Won
Event Chain #2: Impressions > Custom Event: Level Lost
Event Chain #3: Impressions > Custom Event: Level Started
View: % of impressions
Grouping: none
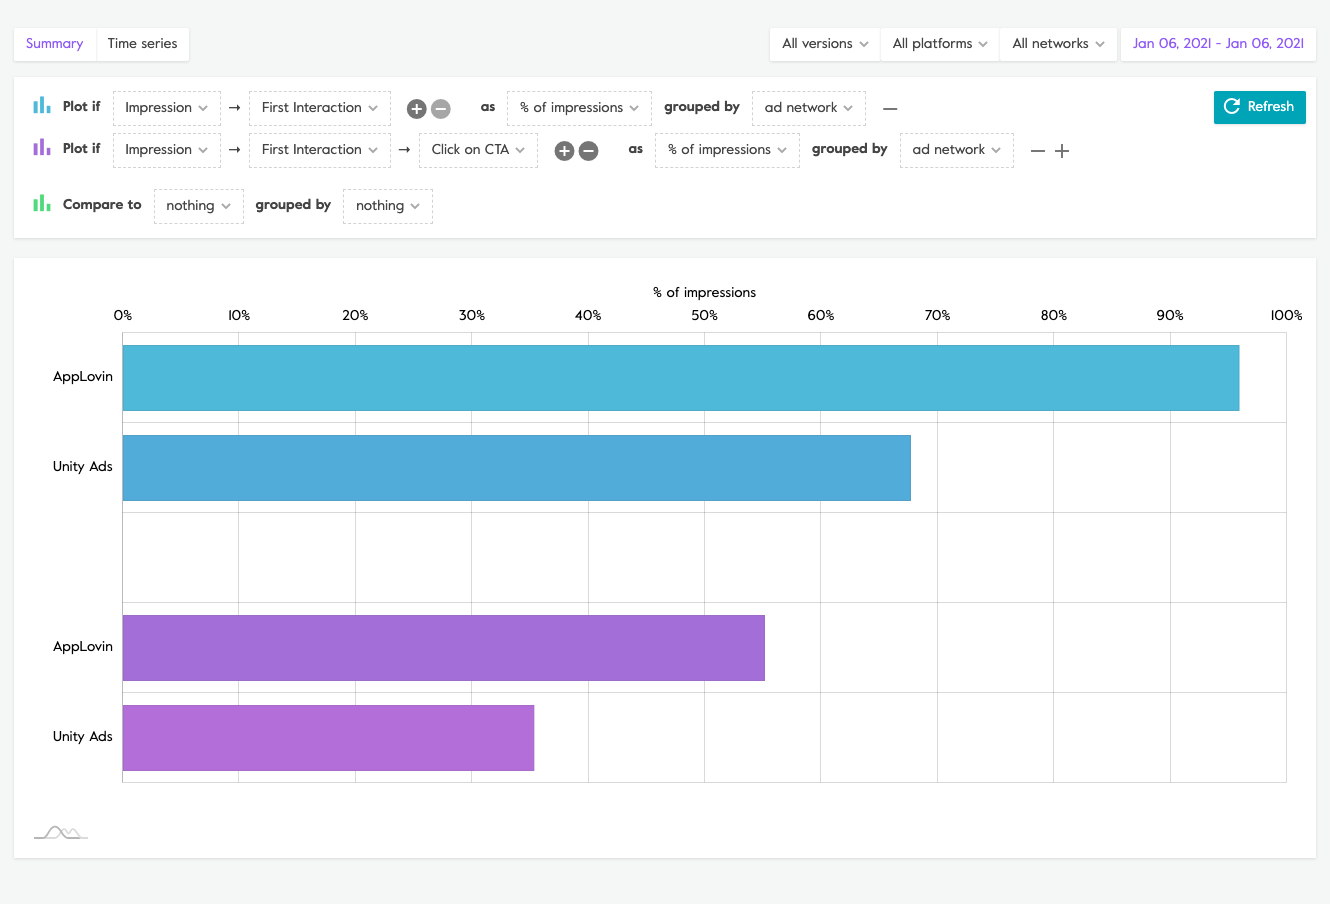
What % of impressions have a first interaction vs those which also have a click on CTA?
Event Chain #1:Impressions > First Interaction
Event Chain #2: Impressions > First Interaction > Click on CTA
View: % of impressions
Grouping: ad network