Performance Indicator
Overview
When building your playable experience in Unity, and C#, it is important to keep in mind that the result will be running in HTML5 on a web browser. As such, optimising the performance as much as possible will result in higher-performing user experiences, with better device support and ultimately, ad performance.
We've assembled several examples and tips which will help you identify and optimise your C# code for better runtime performance on the Unity Playworks Plugin engine.
- This tool was created to give an overall view of playable performance and increase developer awareness about it. This tool is not a profiler tool. For detailed performance information please use built-in browser profiling tools.
- The performance tab is hidden by default but shows playable performance to catch performance issues early
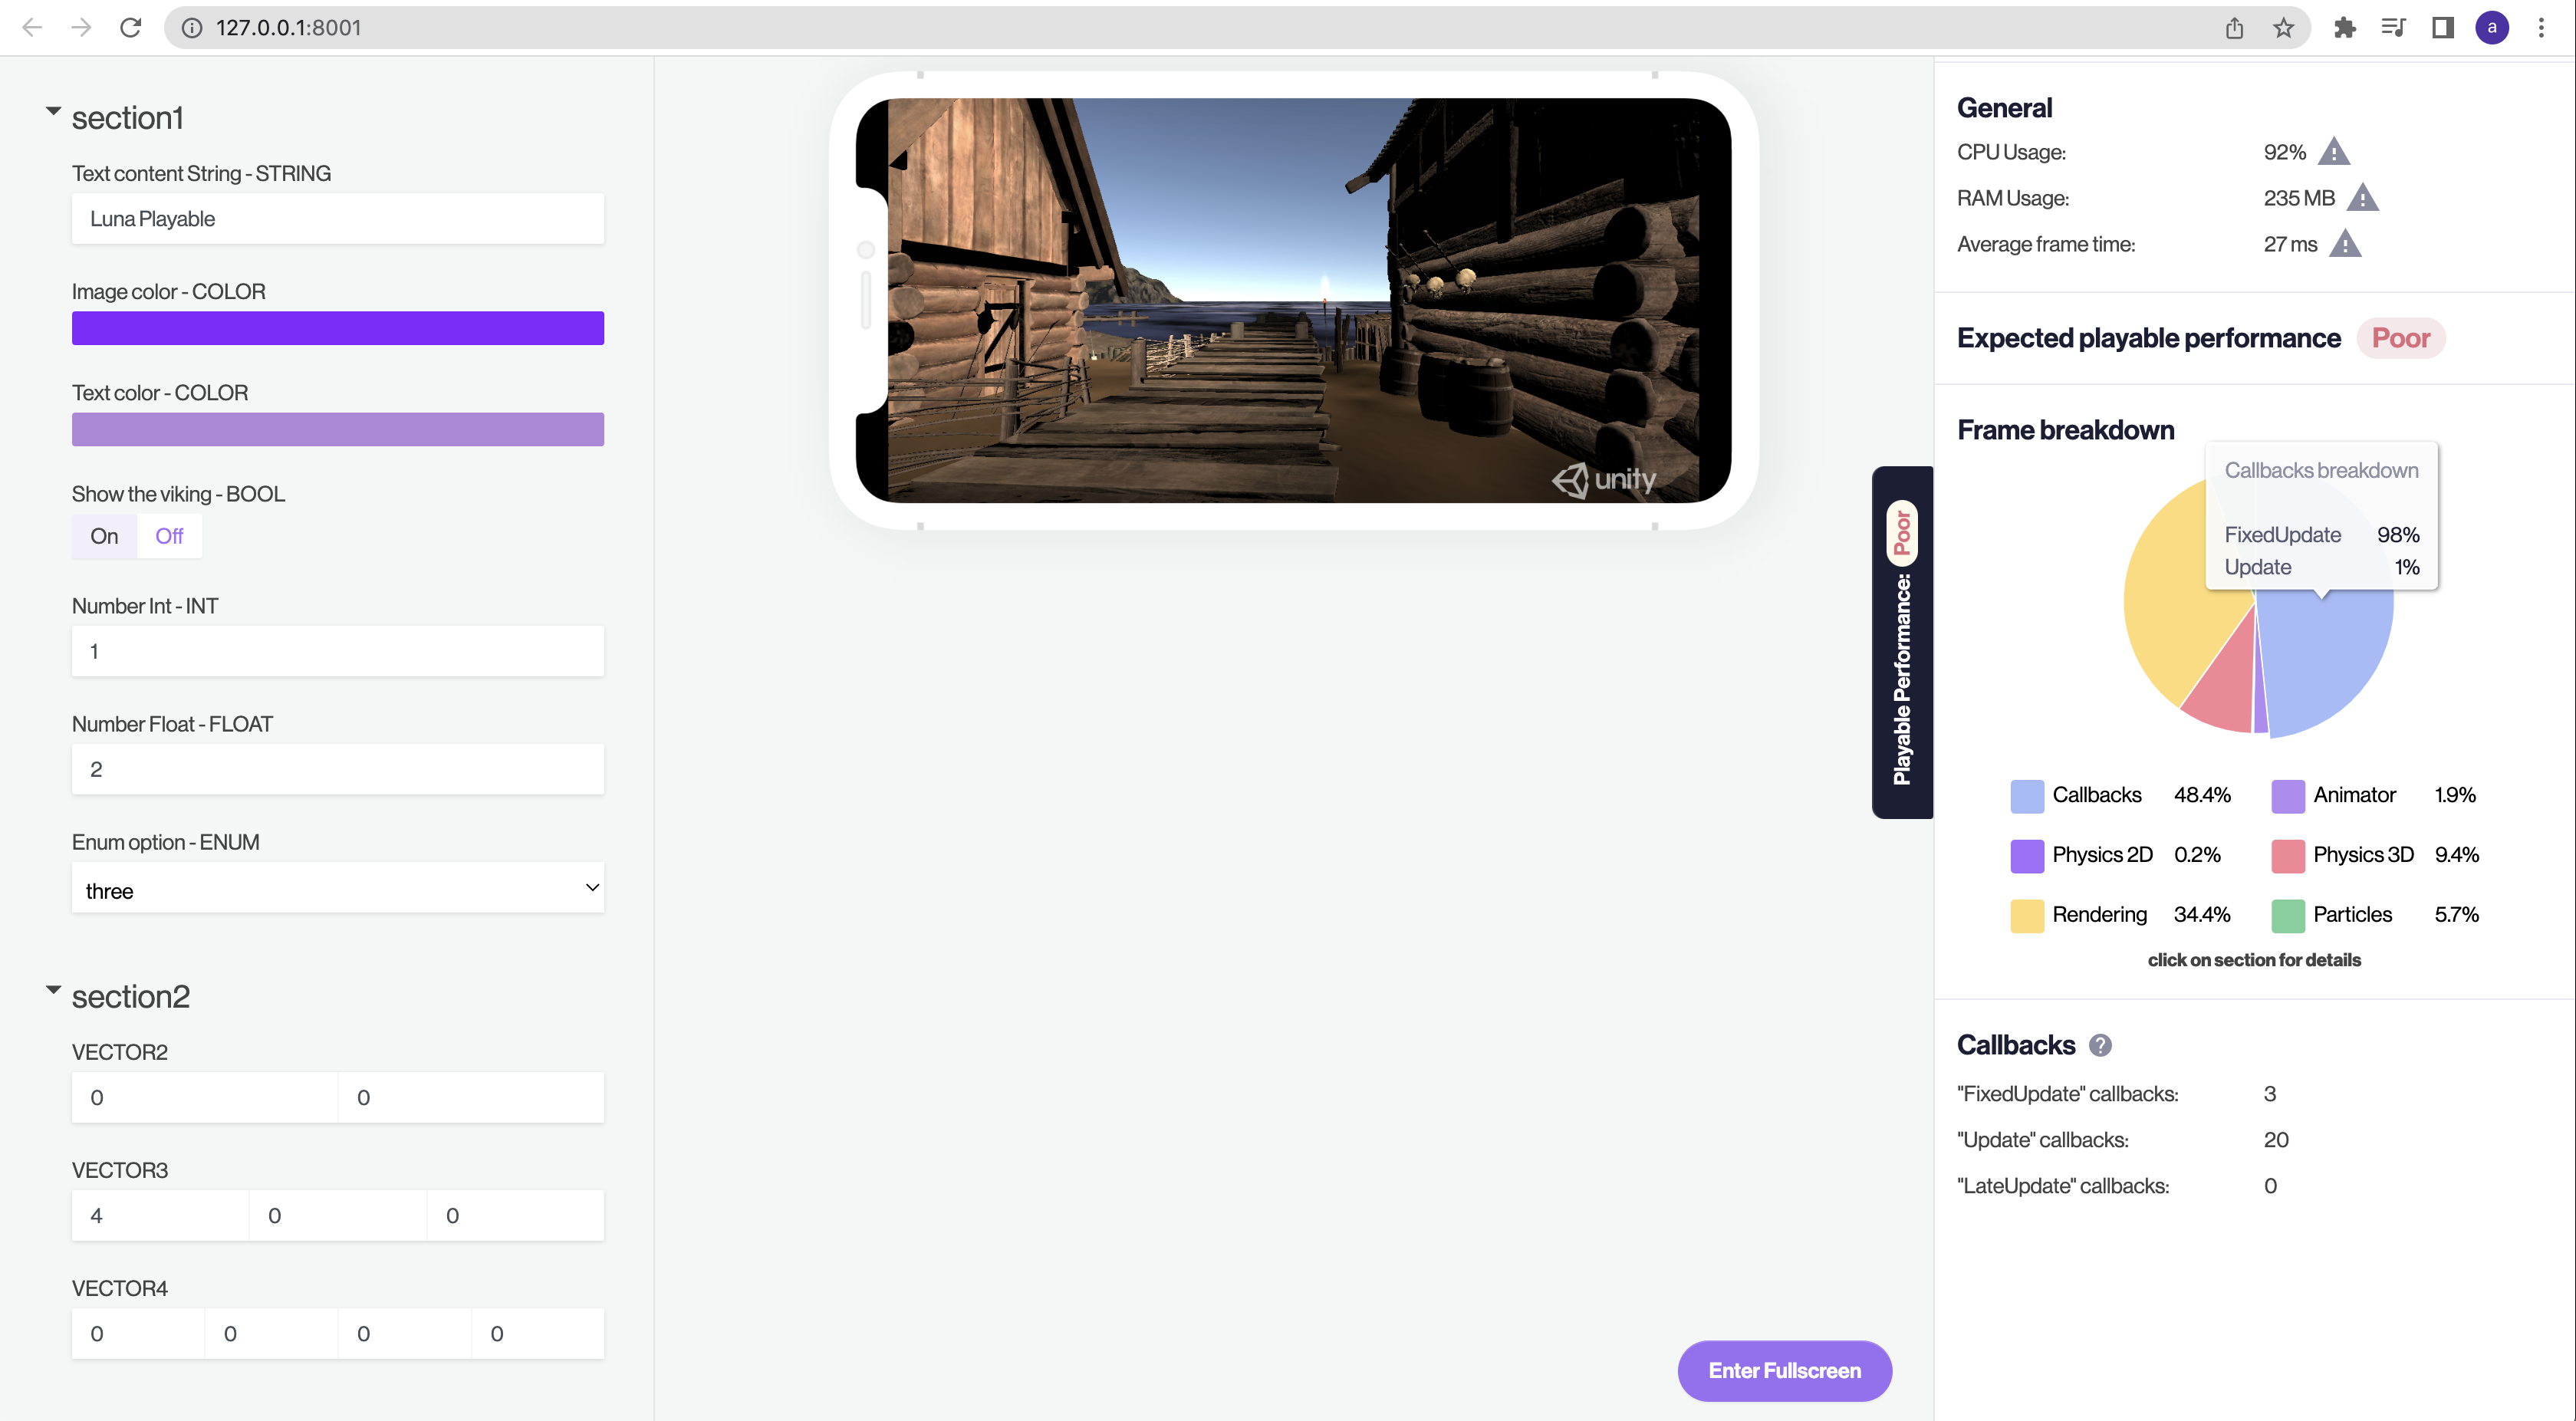
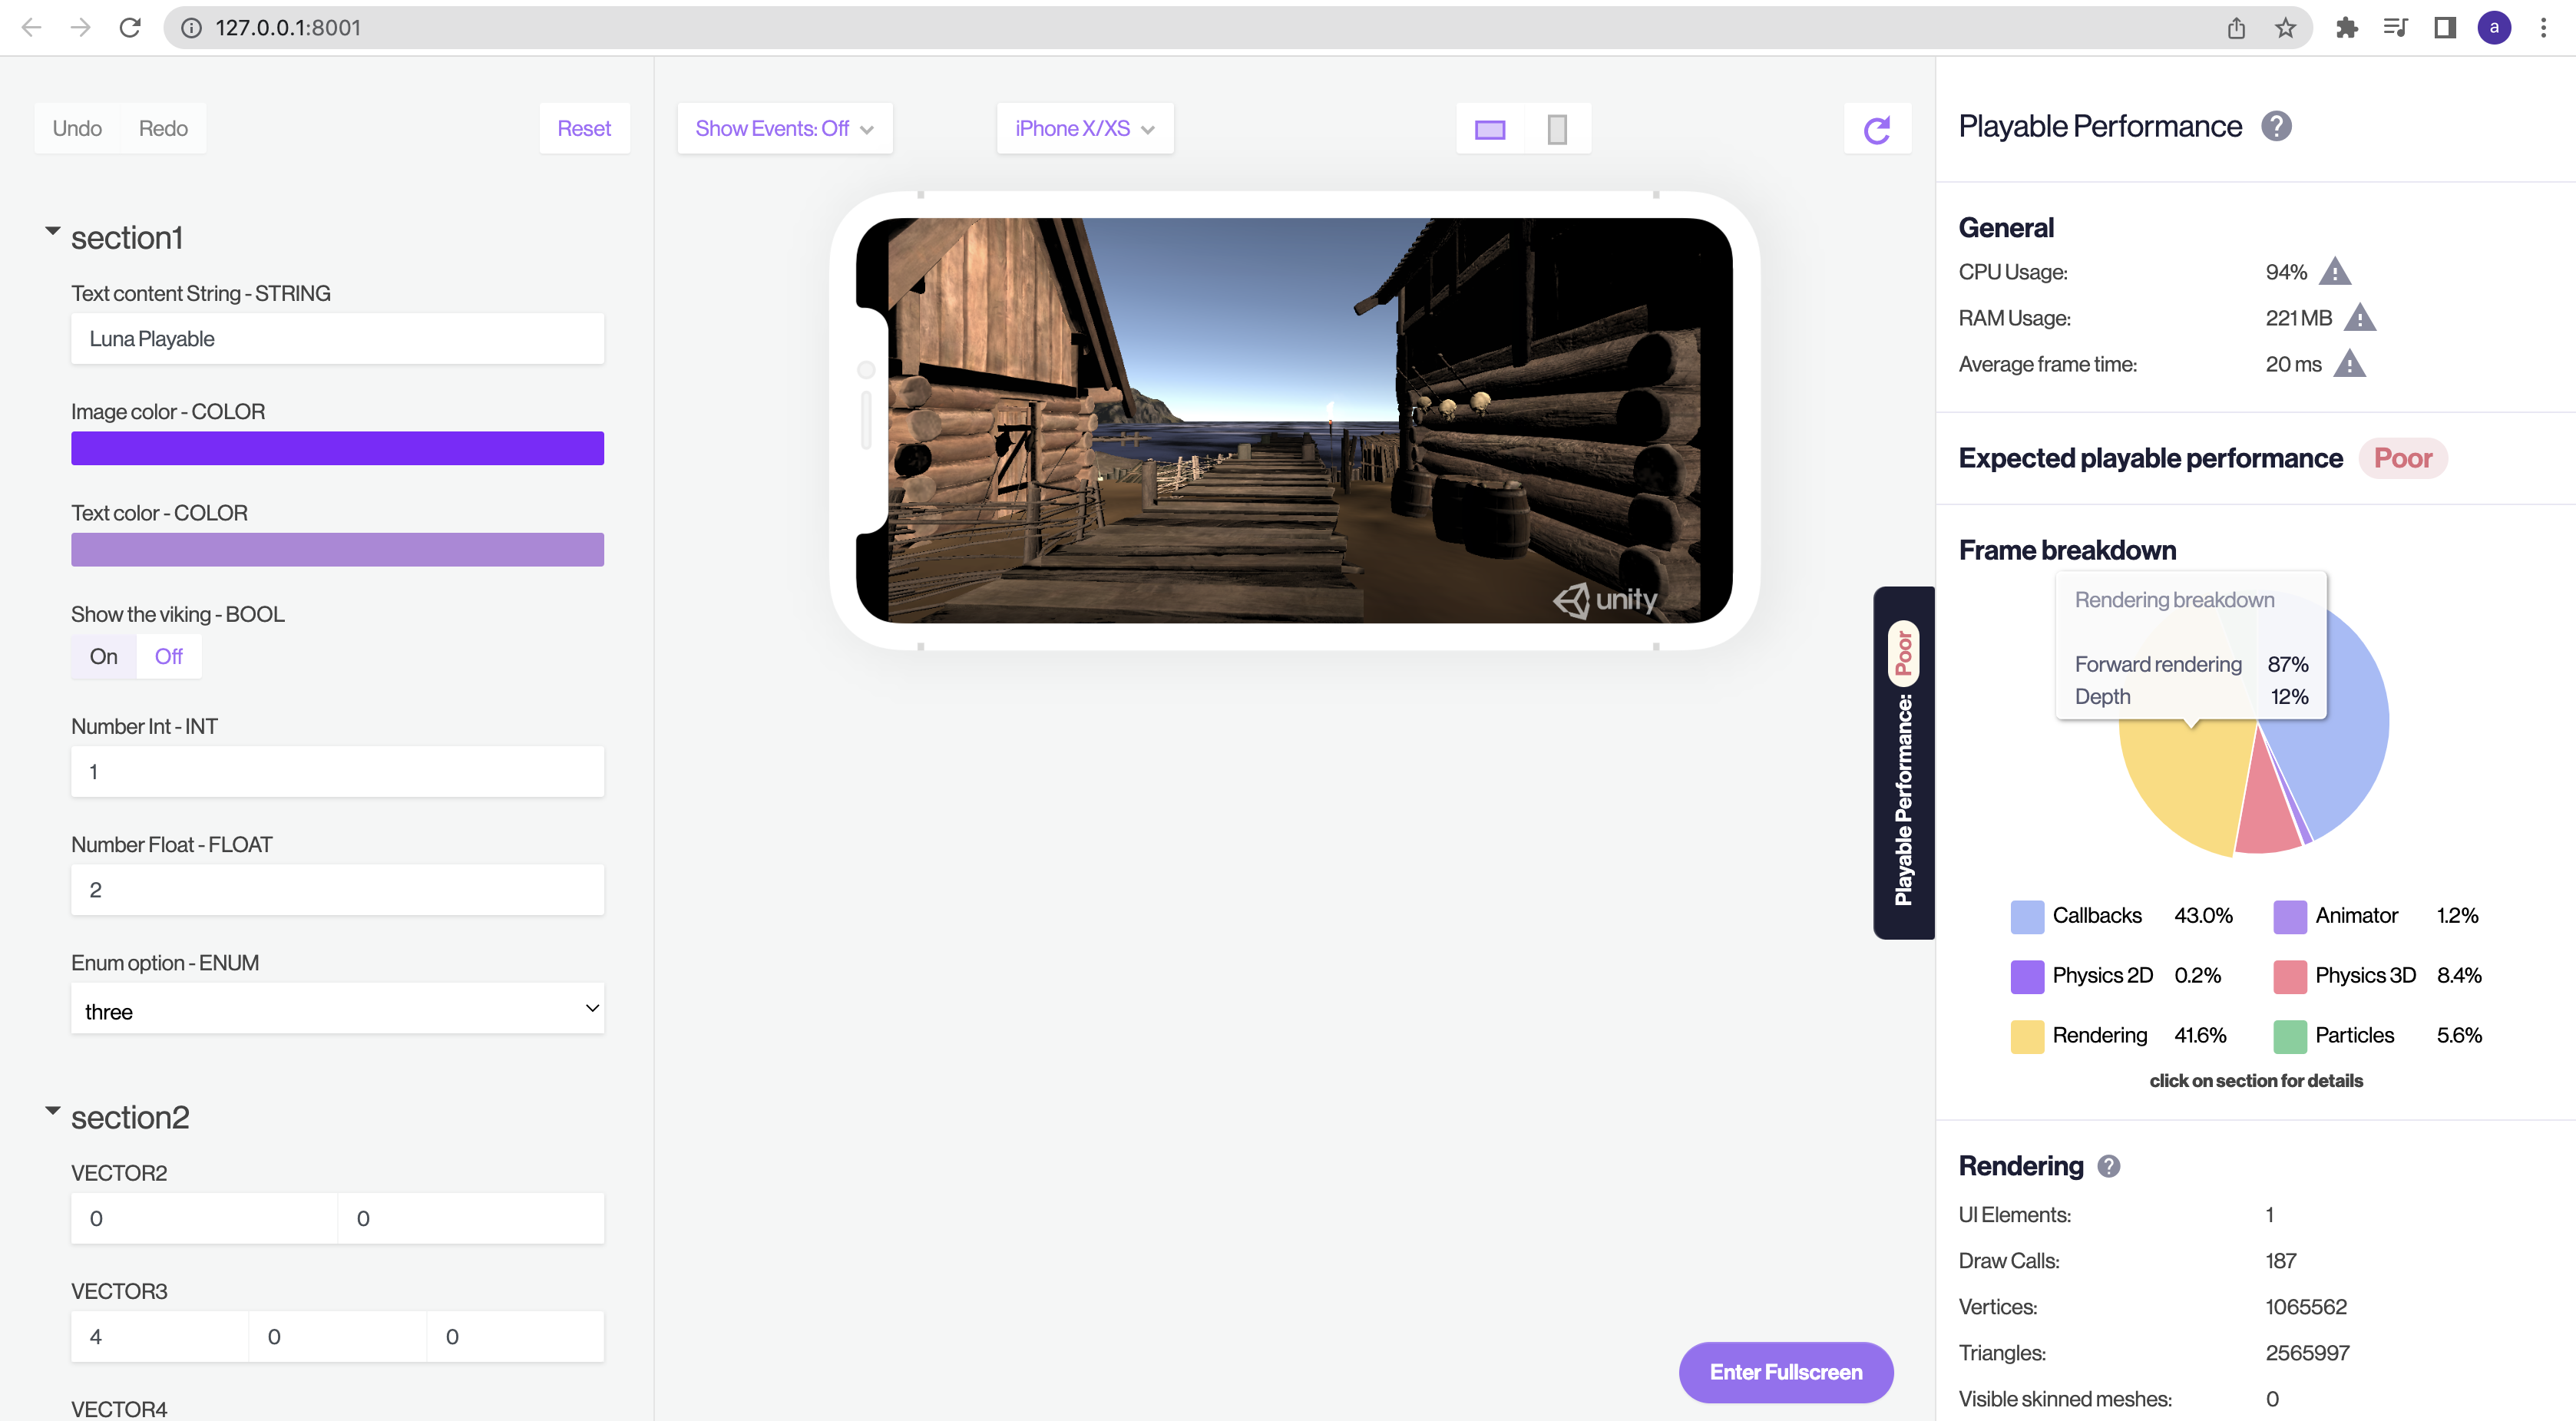
- Frame Breakdown shows details of CPU usage by playable.
- If the subsection takes < 1%, it will be hidden
- The performance indicator is updated every 2 seconds
General Section
Contains basic information about playable performance.
CPU
- Contains summary information about CPU usage by playable. The tool gives you an overall view of CPU usage. For more detailed information use built-in browser profiling tools.
- Calculates the sum of all CPU load by modules of playable like user code, physics, particles etc.
- High CPU usage may cause a low frame rate on mobile devices, especially on the low end. Use the Frame Breakdown section for more detailed CPU usage info.
RAM Usage
- Total memory usage of playable. Shows how much memory the playable uses while running. Represents the sum of allocated memory by code, loaded textures, loaded meshes etc.
Not all browsers are supported! Check the supported browsers list here: Performance.memory - Web APIs | MDN - High memory allocations will cause garbage collector spikes and as a result frame rate drops or even crashes.
- We recommend a RAM value not higher than 256 MB to support low-end devices. The tool gives you an overall view of memory usage. For more detailed information use the browser profiler.
- To decrease RAM usage:
- Simplify your meshes, animations, and other assets.
- Decrease the number of particles.
- Check code for memory leaks and frequent allocations.
- Performance guides:
- Total memory usage of playable. Shows how much memory the playable uses while running. Represents the sum of allocated memory by code, loaded textures, loaded meshes etc.
Average frame time
- Shows how much time (average) was spent to render one frame of playable. This is an approximate value. For more detailed information use the browser profiler.
- Represents summary execution time of all playable modules (physics, particles, user code, rendering etc)
- The higher the values - the lower the frame rate
Expected playable performance
Possible values: Good, Fair, and Poor.
Predicted performance of playable on mobile devices.
Playables with expected FPS < 15 get a “Poor“ score. 15 < FPS < 30 will lead to a “Fair“ score and anything greater will result in a “Good“ score.- Calculation process:
- Measure the average frame time of the device you use to test playable.
- Calculate the coefficient using skybox loading times from the actual device and reference device. We determined that the average time to load skybox on Samsung Galaxy S10+ is 2.5 ms. This device is chosen as an “average“ reference device. The same operation takes 0.5 ms on iPhone XS and 15 ms on Xiaomi Redmi 6. Dividing average skybox load time (2.5ms) by measured skybox load time gives a coefficient which says how faster your device is compared to Galaxy S10+
- Then we multiply our average frame time with the previously calculated coefficient and get the approximate expected frame time on Galaxy S10+, which we convert to FPS.
- Calculation process:
Rembember: Performance on PC != performance on mobile device. This value is estimated for low end device. You can easily run local builds on your test devices (in one LAN network). More information about this can be found here.
Callbacks
List of SubSections
Awake, Start
- Awake/Start callback execution time for all scripts.
- Summary execution time of Awake/Start methods in playable code.
- High Awake/Start execution times may cause spikes and fps drops.
- To optimise:
- Try to reduce the number of objects executing in
AwakeorStart. - If you instantiate many objects at the same time try to reduce their number.
- Check your code for heavy operations in Awake and optimise or completely remove awakes from your code.
- Try to reduce the number of objects executing in
Update, FixedUpdate, LateUpdate
- Update\FixedUpdate\LateUpdate callback execution time for all scripts.
- Summary execution time of Update\FixedUpdate\LateUpdate methods in playable code.
- Update\LateUpdate is called every frame if the MonoBehaviour is enabled. High Update execution times may cause low fps.
- FixedUpdate has the frequency of the physics system. It is called every fixed frame-rate frame. For scenes with huge physics calculations, FixedUpdate may be called multiple times per frame.
- Make sure that there are no allocations inside the Update method ('new' keyword, operations with strings) and other heavy operations. If you use unity API like GetComponent, Find, GetComponentInChildren etc in Update - remove it and use caching. Check other performance-heavy code inside these callbacks and optimise it.
- Performance guides:
List of Counters
"FixedUpdate", "Update", "LateUpdate" callbacks
- total number of active objects with FixedUpdate callback.
- more objects - more calculations - lower frame rate.
- Try to reduce the number of objects using FixedUpdate.
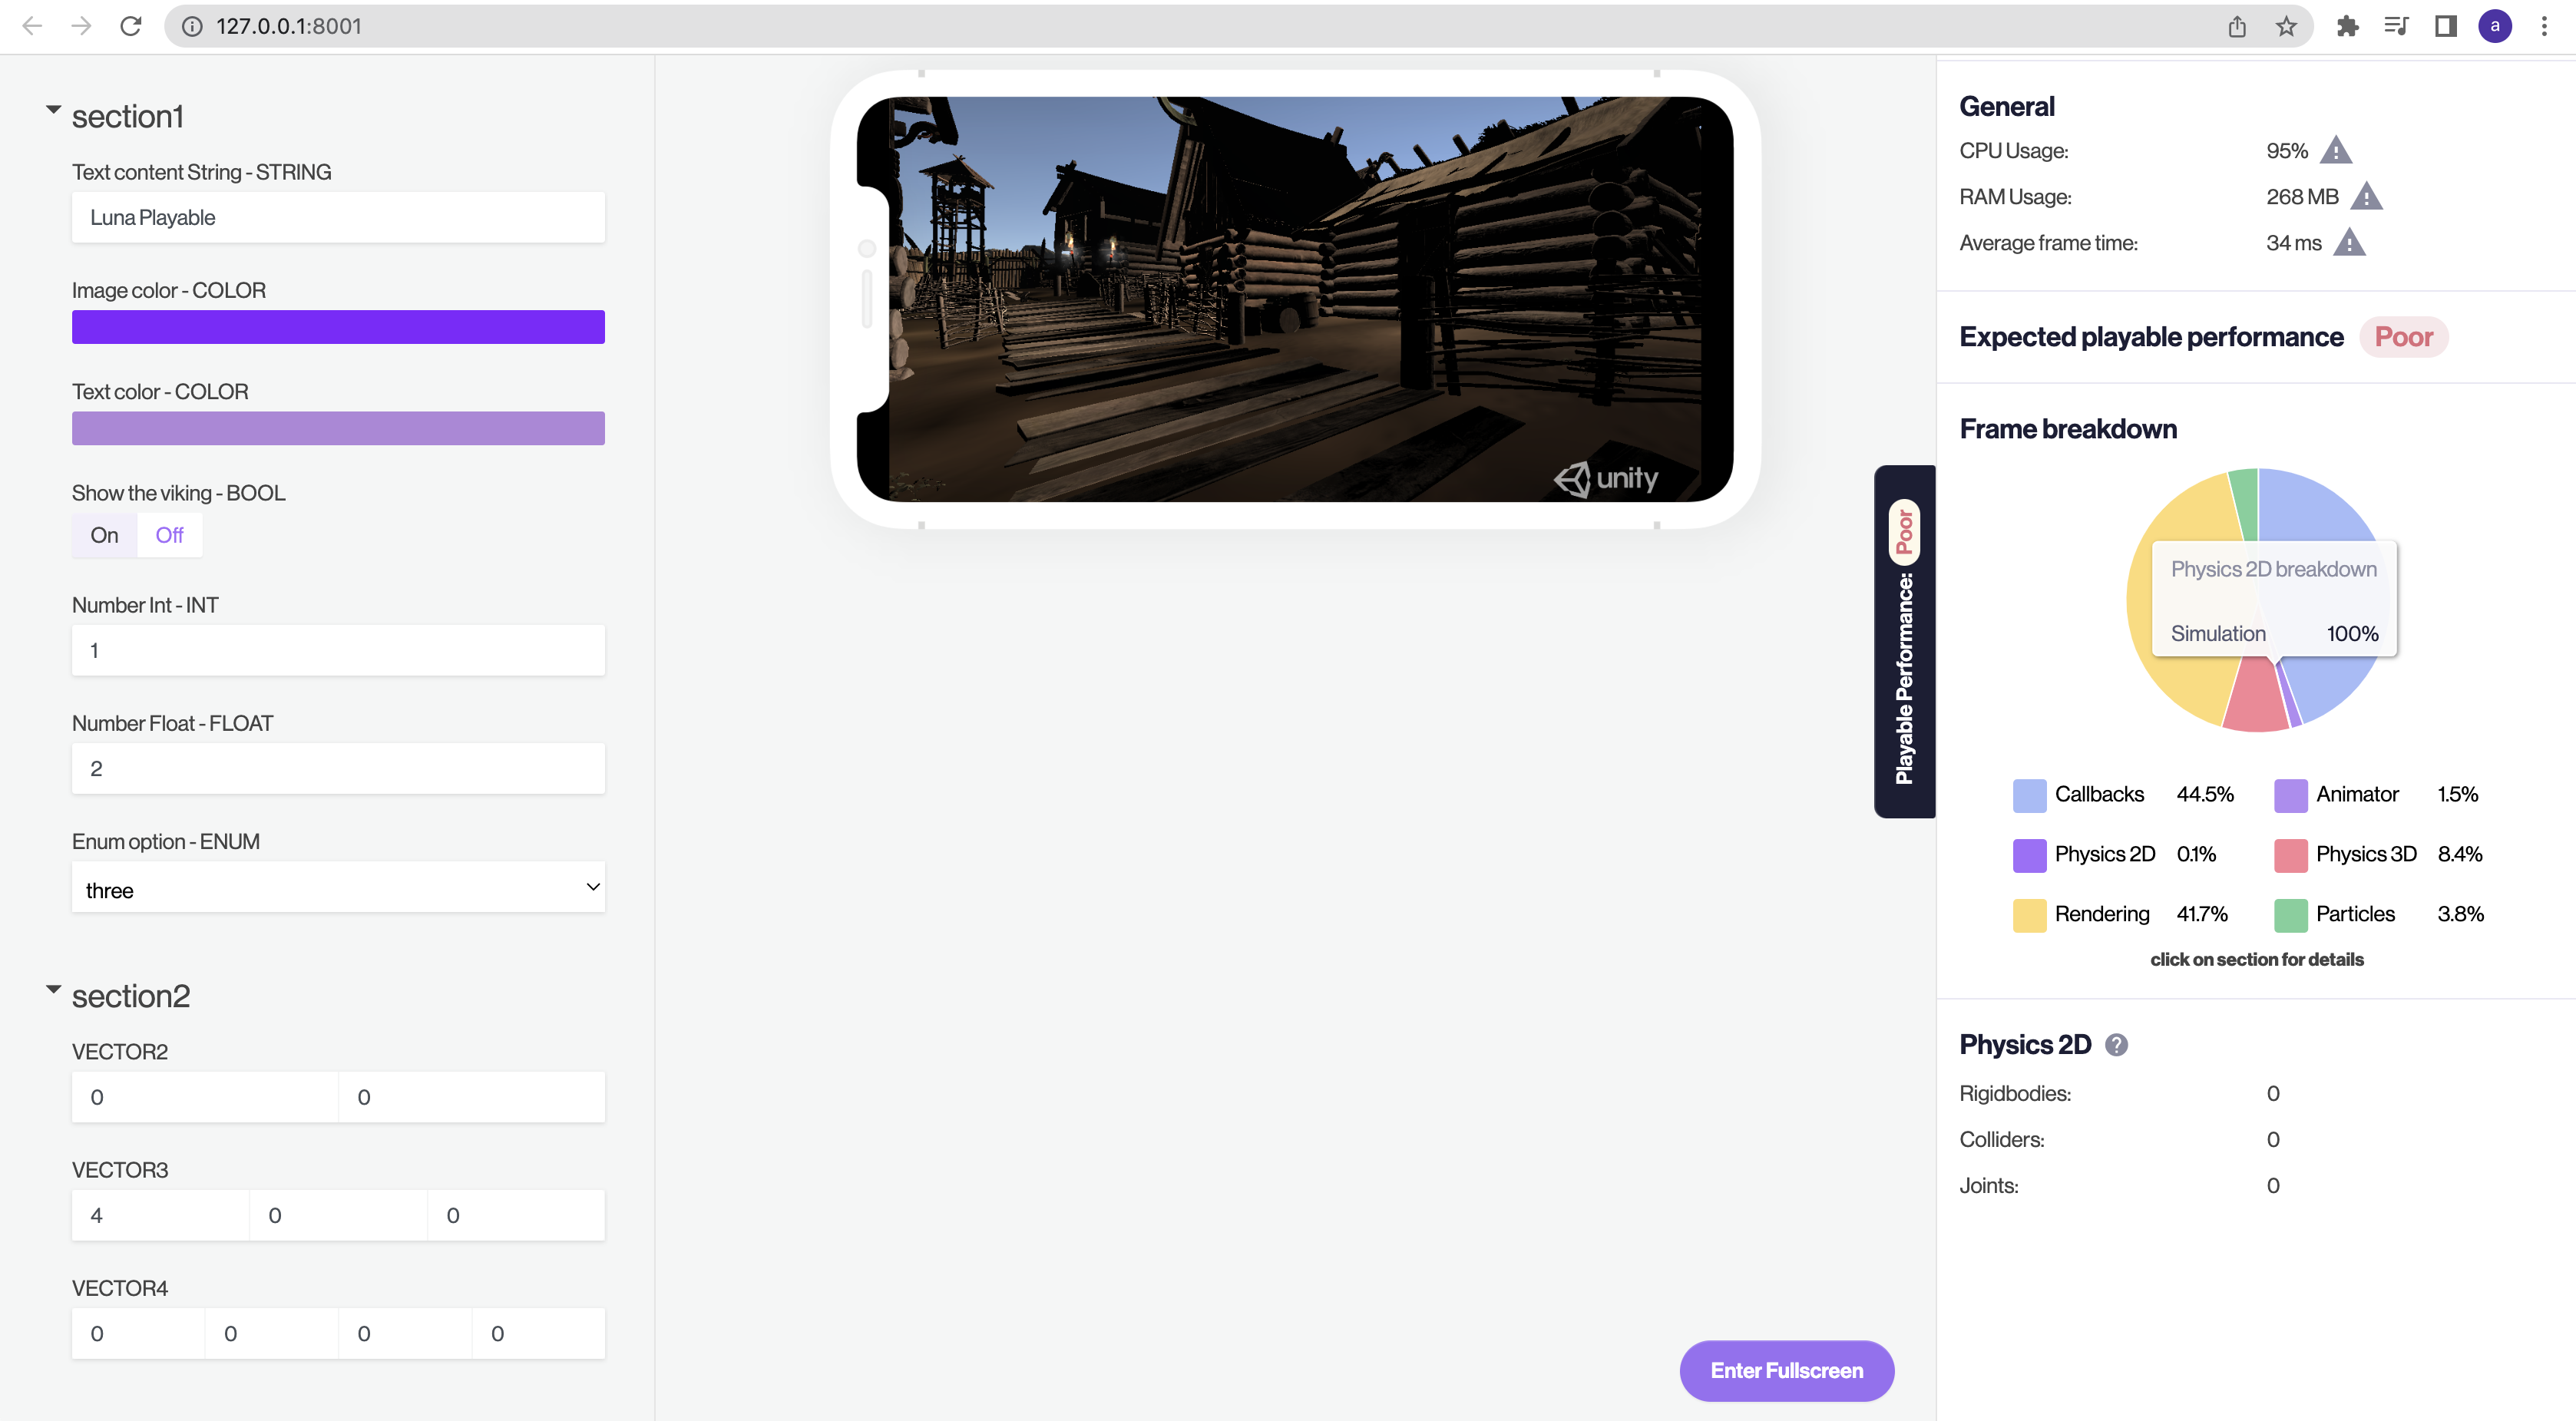
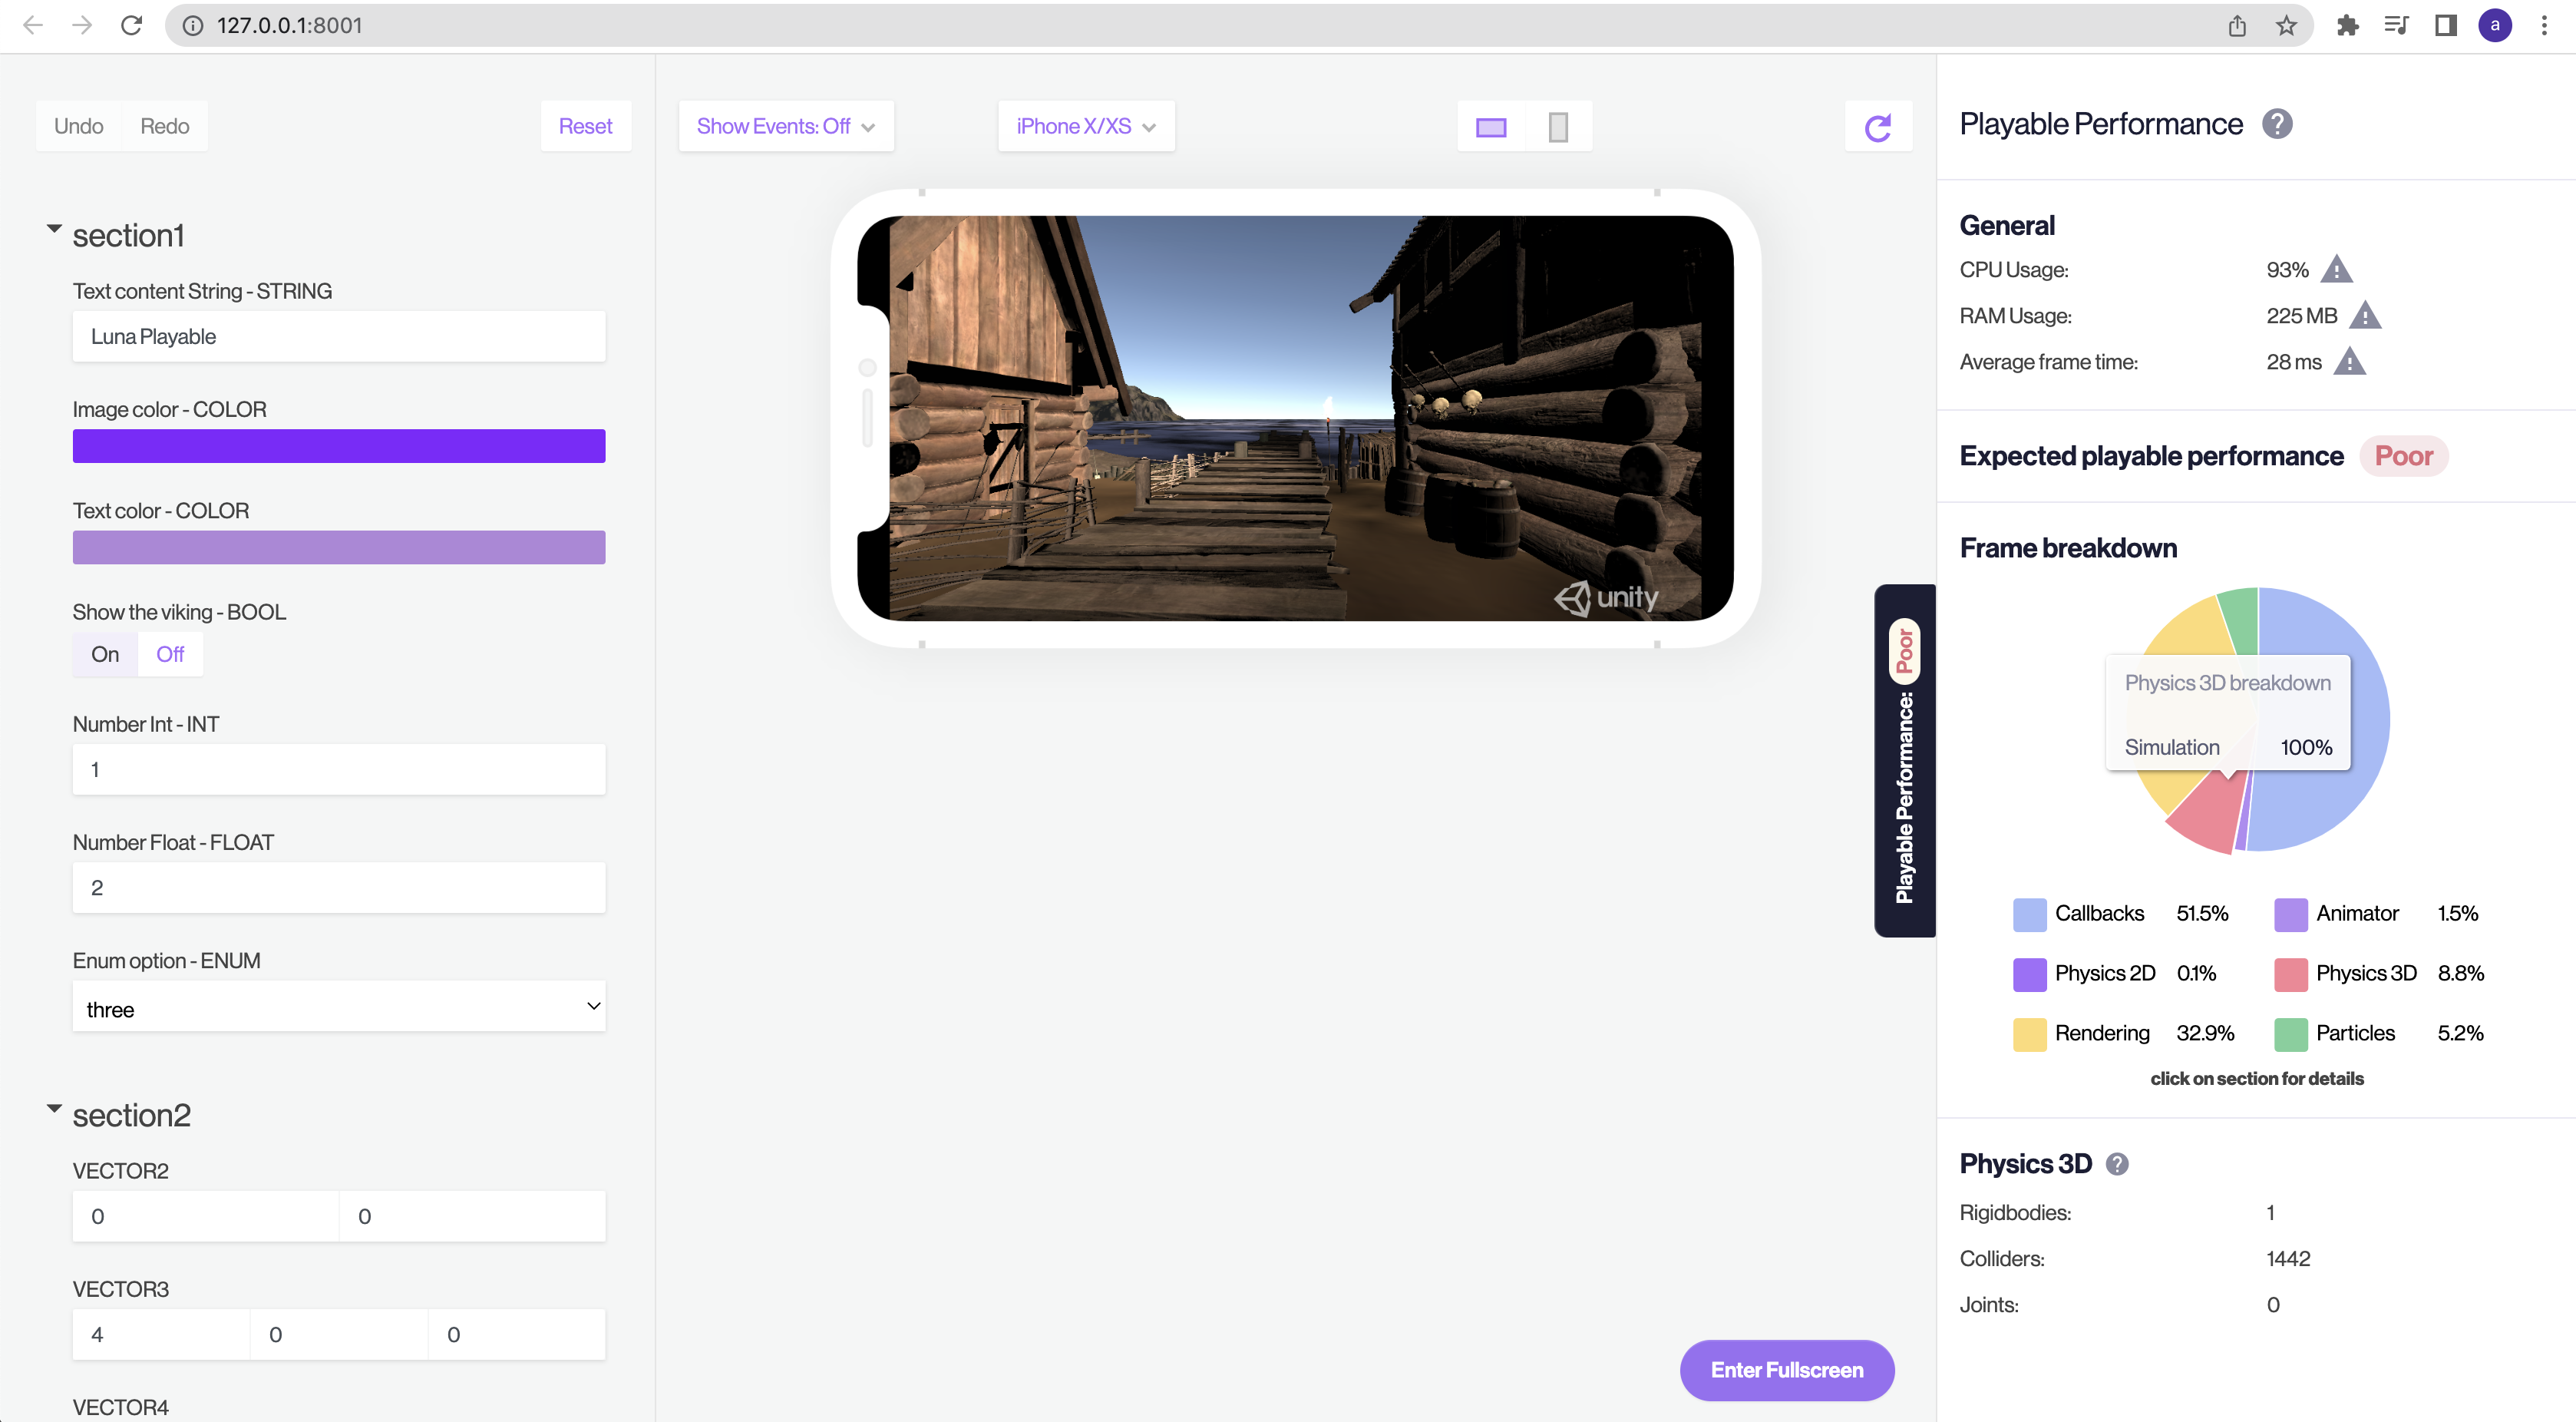
Physics 2D/Physics 3D
OnCollisionEnter2D/OnCollisionEnter/OnCollisionStay2D/OnCollisionStay/OnCollisionExit2D/OnCollisionExit
- Callback execution time for all scripts.
- Summary execution time of callback methods in playable code.
- Physics is already a huge module on its own.
- To optimise:
- Remove heavy operations like
GetComponentorFindfrom this callback. - Check methods for allocations and remove them.
- Reduce the count of callbacks.
- Disable rigidbody components when you don't need collision detection.
- Don't use physics at all.
- Remove heavy operations like
OnTriggerEnter2D/OnTriggerEnter/OnTriggerStay2D/OnTriggerStay/OnTriggerExit2D/OnTriggerExit
- Callback execution time for all scripts.
- Summary execution time of callbacks in playable code.
- Triggers are more simple that colliders, but non-optimized code inside callbacks may affect performance.
Simulation
- if this section has a huge execution time, think about removing physics from playable at all.
Joints
- The average time spent on joints calculations.
- A Joint component connects a Rigidbody to another Rigidbody or a fixed point in space. Joints apply forces that move rigid bodies and limits restrict that movement. Joints simulation is complex and a large amount of joints will cause a performance drop.
- To optimise:
- Reduce number of joints. Disable rigidbodies when you doesnt need joints.
List of Counters
Rigidbodies: total number of active Rigidbodies2D
- total count of active Rigidbodies2D on scene.
- Rigidbodies are simulated objects and their simulation process (especially with continuous collision detection) might influence performance.
- To optimise:
- Reduce the number of rigidbodies.
- Enable rigidbody component only when you need this.
- Switch collision detection to discrete.
- Try not to use physics at all.
Colliders:
- total number active of Colliders2D.
- huge number of active colliders (especially mesh and convex) results in heavier physics calculations.
- To optimise:
- Simplify colliders.
- Try to avoid using mesh colliders:
Based on Mesh, the Mesh Collider creates a collider for the GameObject. The more complex the mesh is, the slower will the collision detection calculations be. Also, if you modify mesh geometry that is used for colliders, the physics engine has to rebuild the collider every time you change the mesh. In most cases, primitive colliders like a box collider or a sphere collider are enough and there is no need to use mesh colliders.
Joints
- The total number of active joints.
- A Joint component connects a Rigidbody to another Rigidbody or a fixed point in space. Joints apply forces that move rigid bodies and limits restrict that movement. Joints simulation is complex and a large amount of joints will cause a performance drop.
- To optimise:
- Reduce number of joints.
- Try not to use joints at all.
- Disable joints and Rigidbodies that you don't need.
Particles
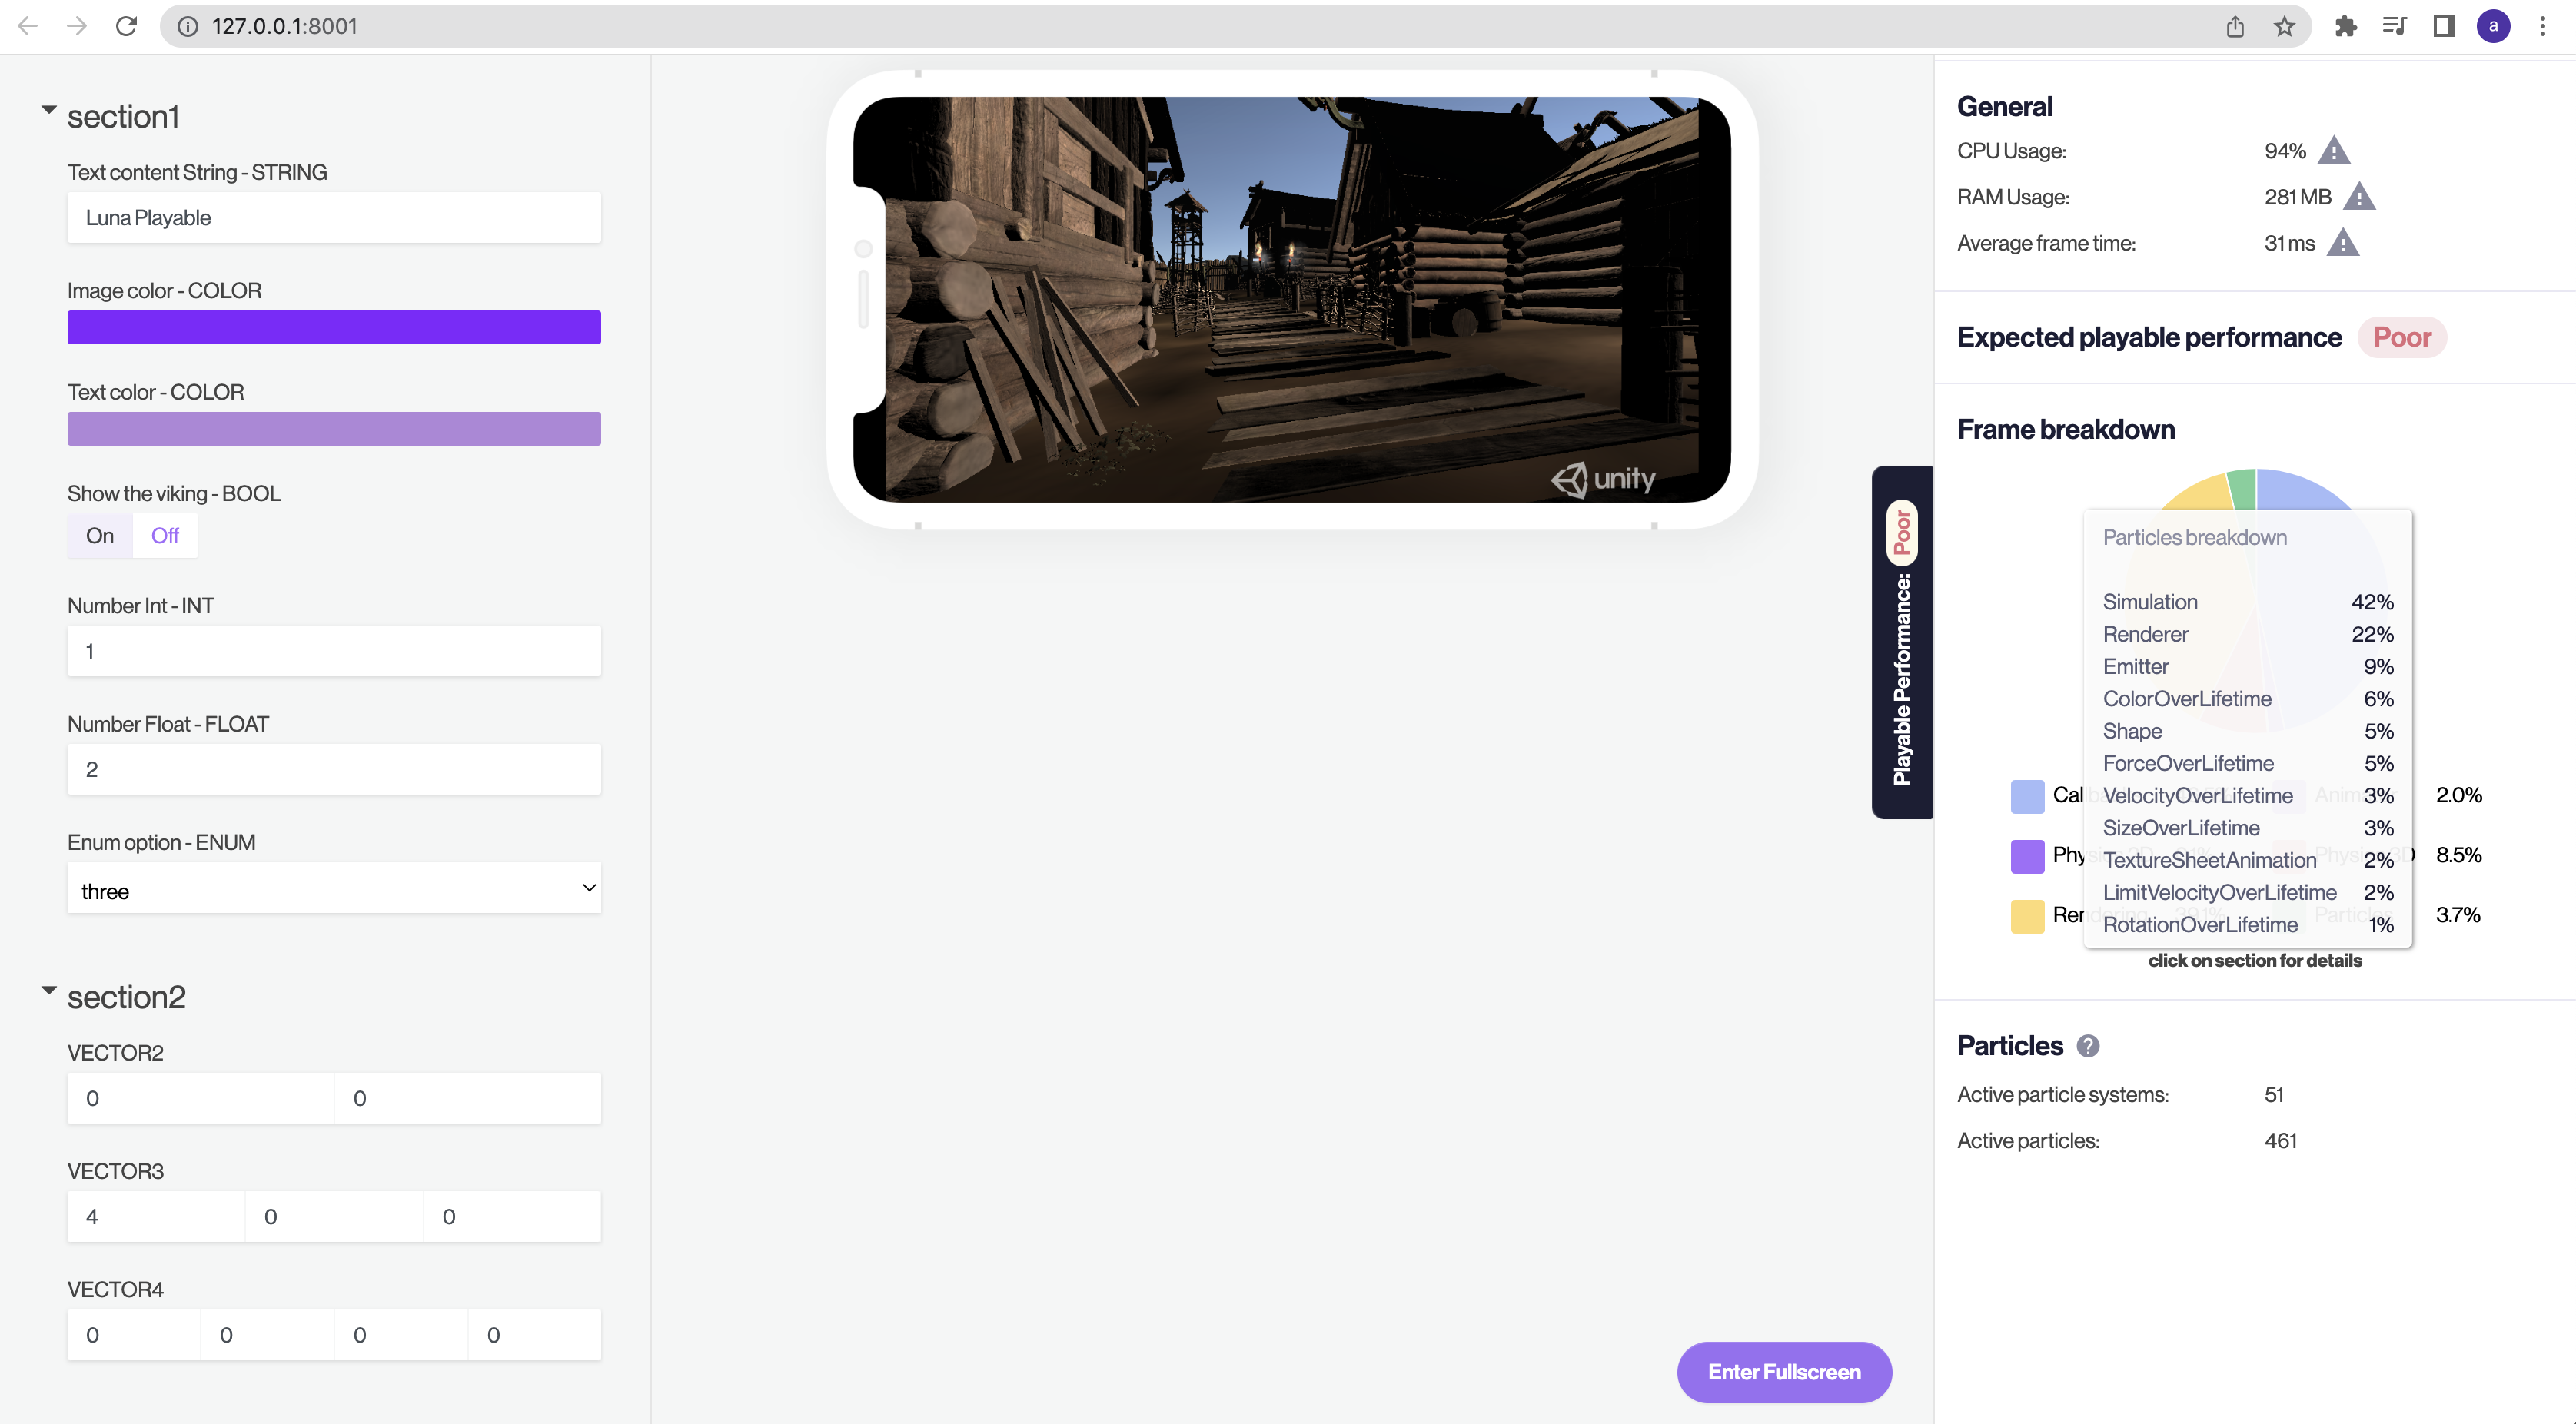
Renderer
- The time spent by the active particle systems to prepare particles for rendering. This module also create instances and do all essential calculations for this on CPU. It then transfer data to GPU.
- Huge number of particles will increase startup time.
- To optimise:
- The most simple way is to reduce particles or particle systems count.
ColorBySpeed, ColorOverLifetime
- This module uses color gradient and do calculations for every particle.
- A big number of gradient colors may increase calculation complexity.
ForceOverLifetime, InheritVelocity, LimitVelocityOverLifetime, RotationBySpeed, RotationOverLifetime, SizeBySpeed, SizeOverLifetime, VelocityOverLifetime
- This module uses MinMaxCurves and do calculations for every particle.
- Complex curves may increase calculation complexity.
- To optimise:
- Use constant values instead of curves or simplify curve.
- Decrease number of particles.
Noise
- Uses MinMaxCurves and the perlin noise function.
- Does calculations for every particle.
- To optimise:
- Use constant values instead of curves or simplify curve.
- Decrease number of particles.
TextureSheetAnimation
- Caclulates the particle sheet animation or sprites array for every particle.
- May use MinMaxCurves which also increases calculation complexity.
- To optimise:
- Do not use complex animation sheets, decrease the number of sprites in case you use Sprites mode.
- Decrease number of particles.
- Use constant values instead of curves or simplify the curves.
Shape
- Generates translation, rotation and direction for a particle basing on selected shape.
- executes for every particle.
- To optimise:
- decrease particles count.
Emitter
- Calculates the number of particles that should be spawned. Also may spawn particles according to MinMaxCurve.
- Spawning many particles will increase the calculation times of all particle system modules.
- To optimise:
- Control particles spawning using ParticleSystem.main.maxParticles.decrease burst values. if you use curves, try to simplify them or use constant vlues
Simulation
- Most of the modules uses MinMaxCurve. For complex curves evaluation process may be slow. Try to avoid curves and use constant values instead.
List of Counters
Active particle systems:
- Total count of active particle systems.
- Number of active particle systems in scene.
- To optimise:
- Try to reduce the number of particle systems.
- Try to disable particle systems when they unneeded.
Active particles:
- Total count of alive particles.
- Number of alive particles in scene.
- To optimise:
- reduce cont of alive particles.
Animator
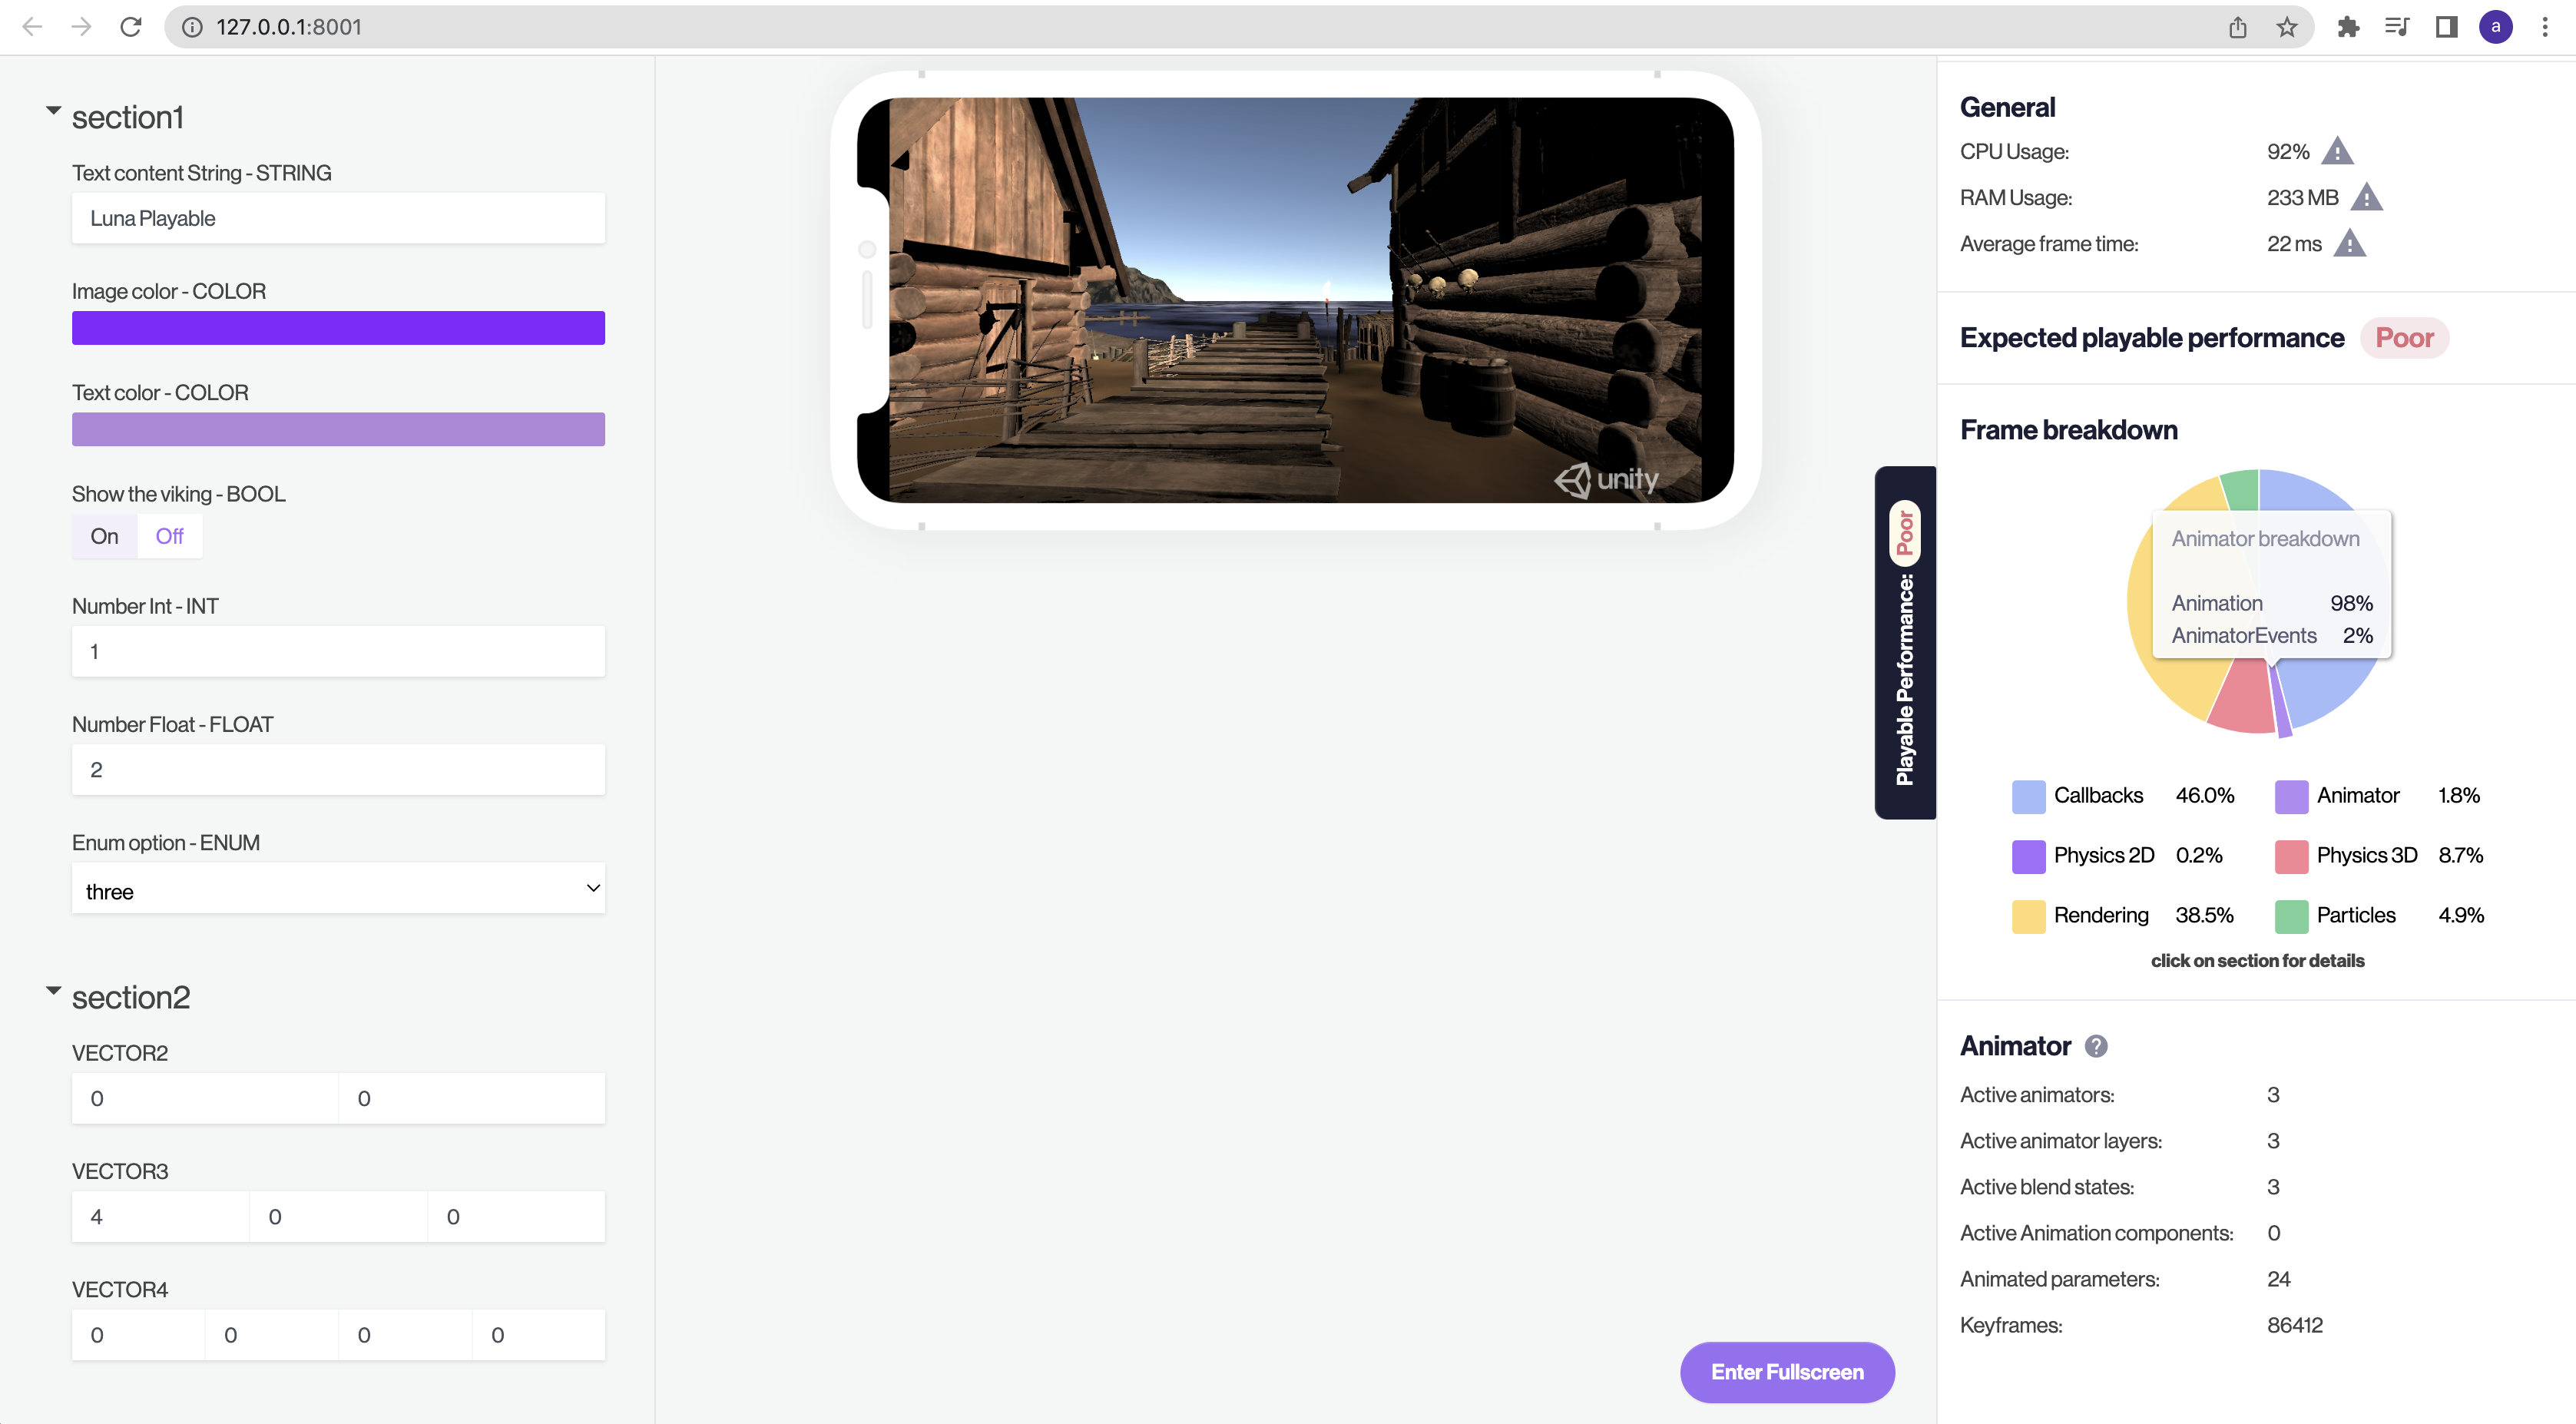
Animation
- Total execution time of all active animation components on scene.
- Complex animations with big count o keyframes may affect performance.
Animation\Animator Events
- Execution time of code that is subscribed to animation clip events.
- Huge operations inside callbacks may cause performance spikes.
- To optimise:
- Remove allocations and huge operations from callback.
- Unity - Manual: Performance and optimization.
Animator
- Total execution time of all active animators.
- Animator is complex system. It contains logic that blends animations between each other, blends layers, interpolates animation keys. Every animation clip consists of animated parameters of a component which contains animation keys. The keys are interpolated between each other by a configurable curve. A high number of keys will create a more complex curve and subsequently, calculating interpolation gets more expensive.
List of Counters
Active animators:
- Number of total active animators.
- A huge number of animators working at the same time may affect performance.
- To optimise:
- Remove unneeded animators, animation assets or make animations more simple.
Active animator layers:
- Total number of layers of active animators.
- Blending animation layers inside animator is quite complex and may affect performance.
- To optimise:
- avoid using animators with more than one layer.
Active blend states:
- Total number of bend states currently performing.
- Blending animations together is a complex process. Blending a lot of animations at the same time may affect performance.
- To optimise:
- Merge animations (if possible).
- Decrase number of keyframes.
- Remove or deactivate unneeded animators.
Active components:
- The total number of active animation components ( not animation assets ).
- A huge amount of animation components working at the same time may affect performance.
- To optimise:
- Try remove unneeded animation components and make the animations more simple.
Animated parameters:
- The total number of parameters used current playing animations.
- When the parameters changes, the more time it needs.
- To optimise:
- Try and remove unneeded parameters from the animation.
Keyframes:
- The total count of animation curve keys of the current animated parameters.
- Interpolation between keys may affect performance.
- To optimise:
- Try to reduce the number of keys inside the animation assets.
Rendering
Unity - Manual: Graphics performance fundamentals
Depth
- Total depth rendering time: this consists of the time that Unity Playworks Plugin spends when rendering all depth passes.
- Depth rendering is an additional pass. A high number of passes may affect performance.
- To optimise:
- Reduce the number of shaders that are using depth.
- Reduce the number of cameras that have depth only clear flags.
UI
- The total UI rendering time: this consists of time that Unity Playworks Plugin spends on rendering UI canvases.
- A huge number of UI elements will affect performance.
- To optimise:
- Try to reduce the number of UI elements.
Skin And Morph
- The totals skinned meshes and blend shapes rendering time: this is the time that Unity Playworks Plugin took on rendering skinned meshes and blend shapes.
- Skinned mesh preparation contains calculations for every bone.
- To optimise:
- Simplify skinned mesh or remove unneeded bones.
- Reduce number of skinned meshes (blend shapes).
Shadows
- The total real-time shadows rendering time: this consists of the time that Unity Playworks Plugin takes when rendering real time shadow cascades.
- Rendering shadows is complex operation: the more objects cast shadows, the more time will be spent on shadows calculations.
- To optimise:
- Do not use real time shadows with static objects, bake it.
- Do not use real time shadows at all.
- Decrease shadows quality.
- Reduce number of objects that cast shadows.
List of Counters
UI Interactive Templates:
- The total count of rendered UI elements (like buttons, text, etc).
- This increases amount of total vertices and triangles that affects rendering performance.
- To optmise:
- Make UI more simple.
- Remove unneeded elements.
- Combine UI elements where possible.
Draw Calls:
- The number of calls to the GPU to draw objects. This consists of how many objects are drawn to the screen.
- A huge the number may affect performance.
- To optimise:
- Try to reduce the geometry count.
- Bake static geometry into one mesh manually.
- Reduce number of passes in shaders.
Vertices:
- The total number of visible vertices rendered this frame. This is the number of vertices uploaded to GPU.
- Mobile devices have GPU memory restrictions, so geometry with huge amount of vertices may not be rendered at all. Also, the GPU performs operations with vertices in vertex shader. A high number of vertices may cause low performance.
- To optmise:
- Simplify the geometry or remove unneeded geometry from scene.
Triangles:
- The total visible triangles rendered this frame. This is the number of triangles uploaded to the GPU.
- Mobile devices have GPU memory restrictions, so geometry with an high amount of triangles may be rendered incorrectly and cause low performance.
- To optimise:
- Simplify the geometry or remove unneeded geometry from scene.
Visible skinned meshes:
- The number of skinned meshes and blend shapes visible by any camera.
- Many skinned meshes with a high bones number will affect performance.
- To optimise:
- Try to reduce the number of skinned meshes and blend shapes.
- Make skeleton simpler.
Material switches:
- The number of material switches while rendering current frame. Changing render state on GPU is an additional operation that also takes time. A high number of geometry that switch to a different materials may affect frame rate.
- To optimise:
- Render as many geometry as you can using one material.
- Use material palettes or bake textures into atlases.
Shadow casters:
- The total number of rendered shadow casters.
- A high number of shadow caster can affect the performance.
- To optimise:
- Reduce the number of geometry that casts shadows.
- Decrease shadows quality.